
A clearer
read on
every acre.
Crop-health drone mapping for Maryland farms, orchards, and vineyards.
Detect problems before they are visible
Affordable drone imaging for Maryland farms.
📍 Crop Health Maps • Field Comparisons & Mapping • Seasonal Monitoring
WHAT WE FLY
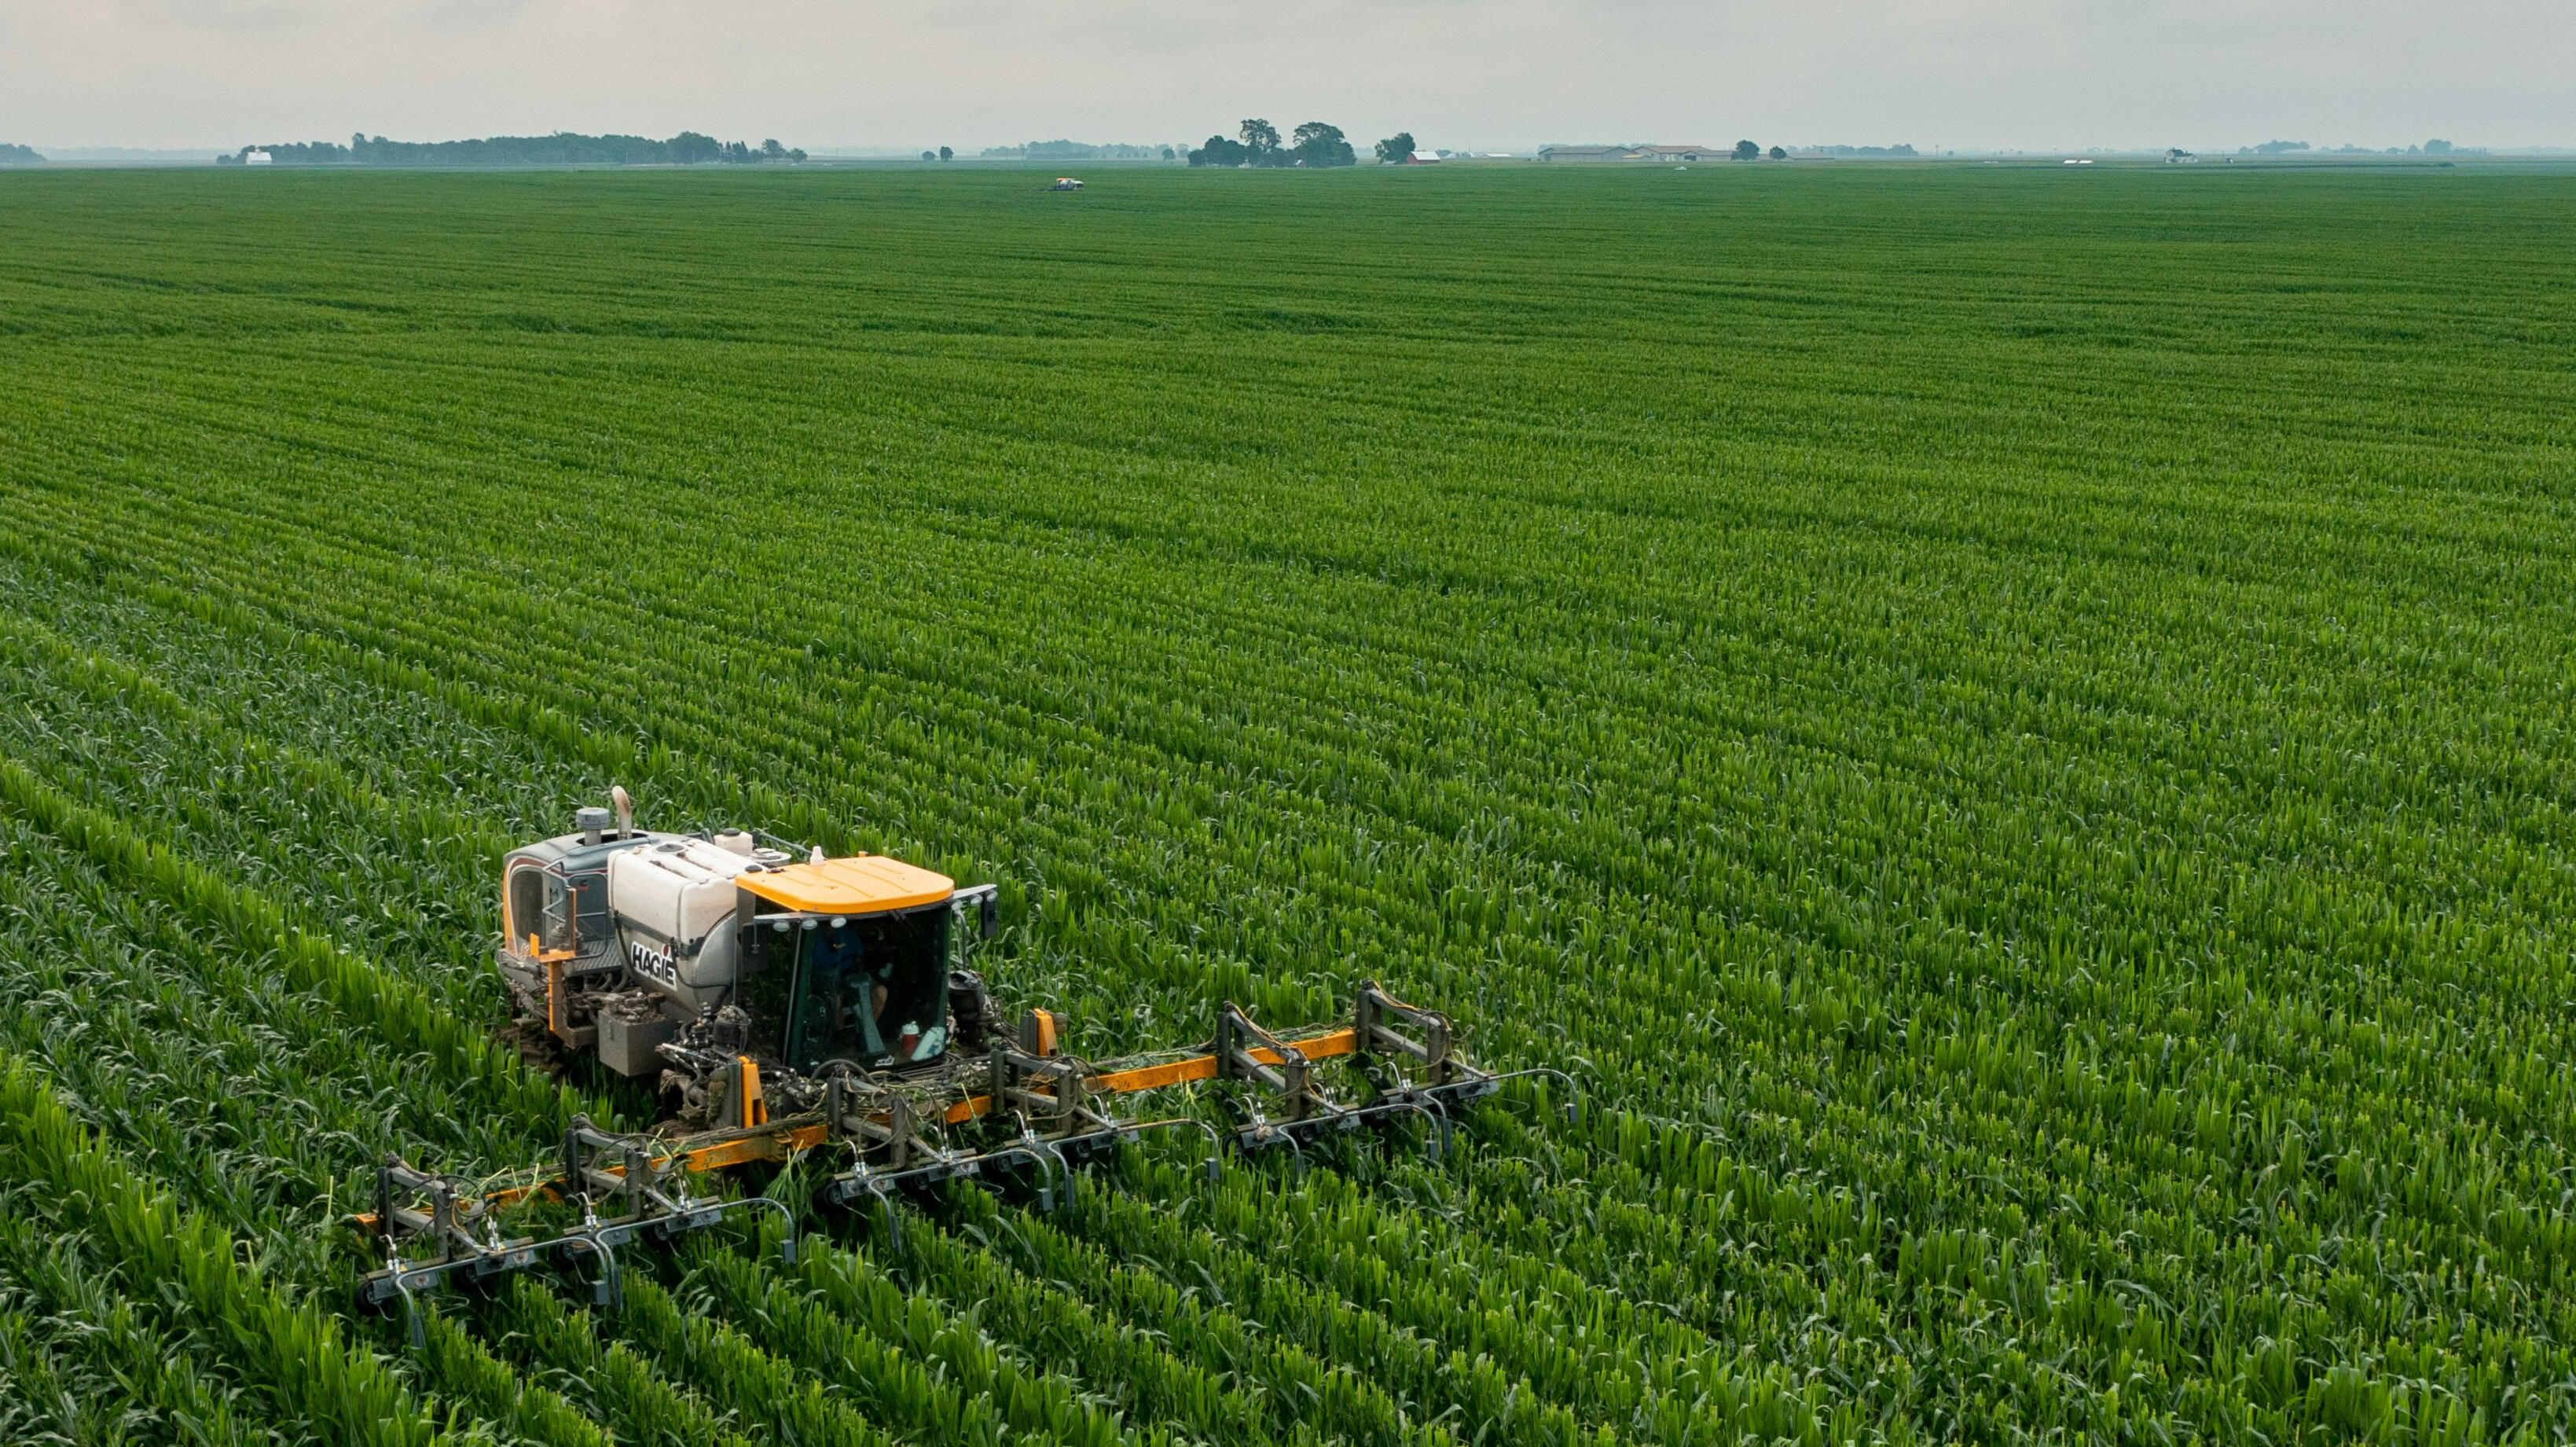
Row crops, tree
fruit, and vines.

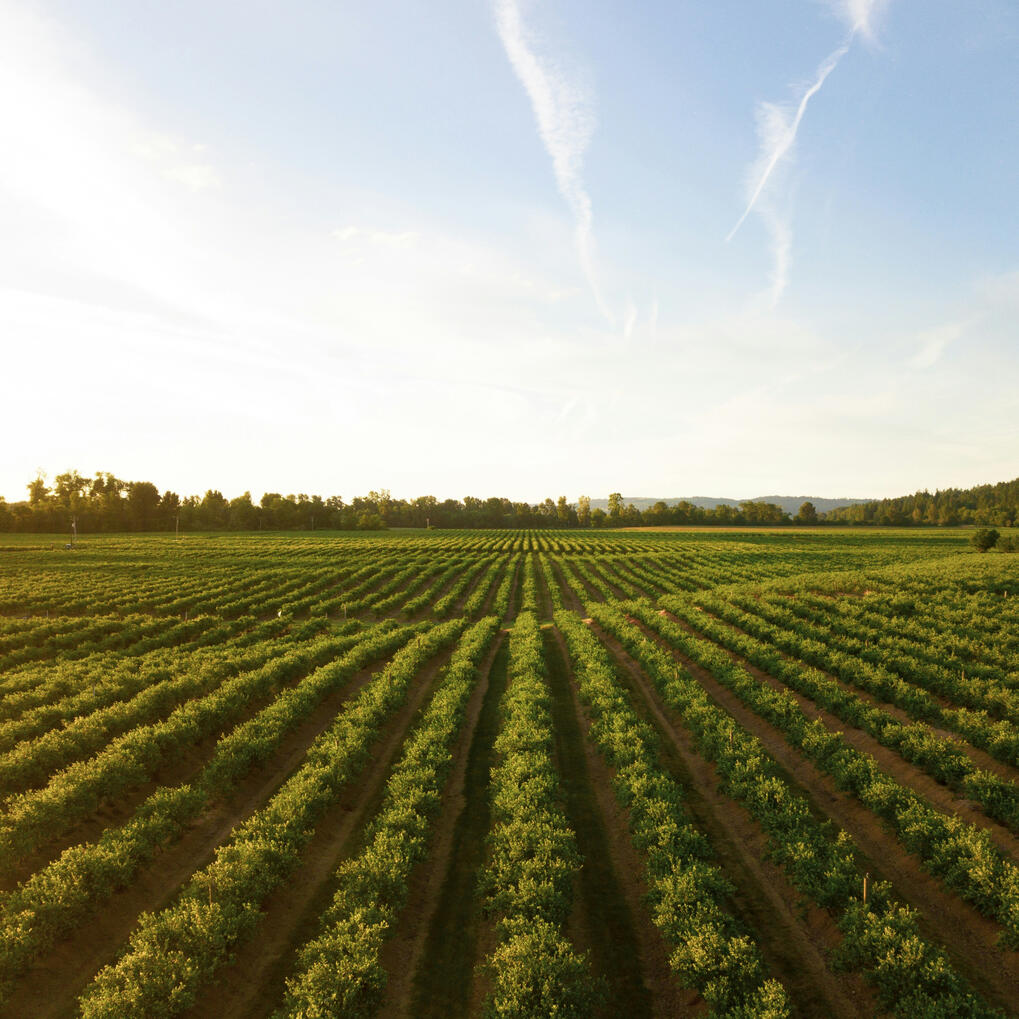
Row Crops

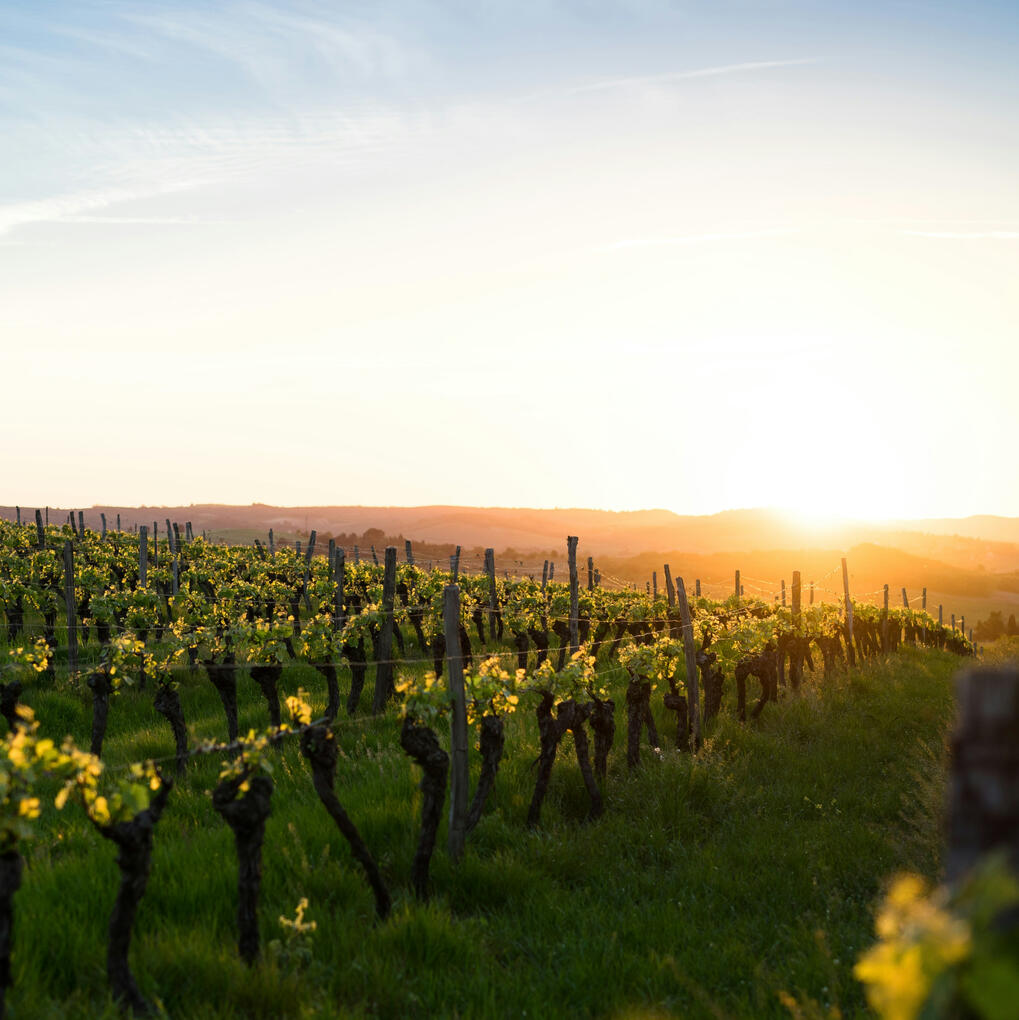
Vineyards

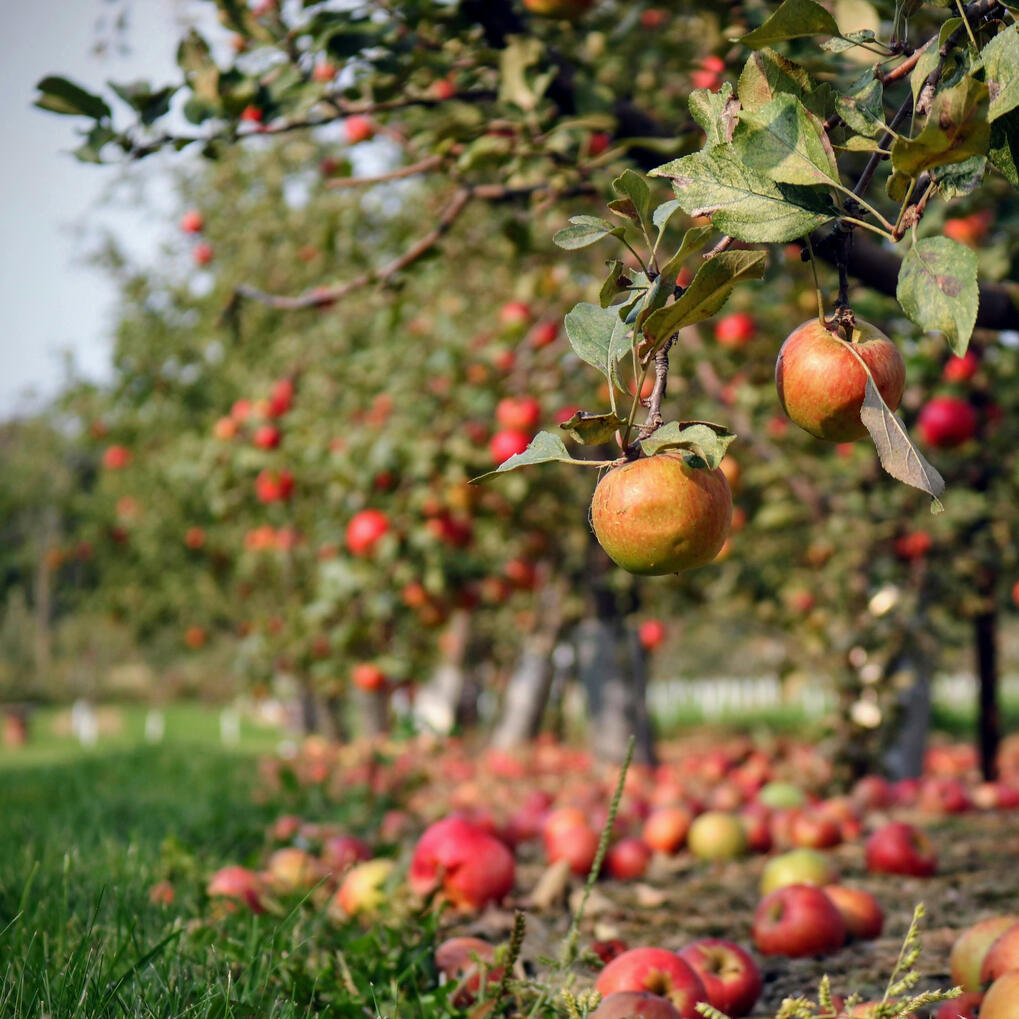
Orchards
We also fly nurseries, sod ground, specialty plots and managed turf.
WHERE WE FLY
Maryland ground,
flown locally.
Crop Cam is a Maryland business working Maryland fields.
That means flights can be fitted around your spray and harvest windows rather than the other way round, and a return visit later in the season is straightforward to arrange.

WHY IT MATTERS
Fewer acres to walk,
and the right ones.
| 1. Spot patterns earlier | 2. Check the right acres first | 3. Compare over time |
|---|---|---|
| A corner that has fallen behind the rest of the block shows up while it is still only a corner. | Your time and your inputs go where the measurement says they will count, instead of across the whole field evenly. | The same ground flown the same way in June and again in August gives you two pictures that genuinely line up. |
HOW IT WORKS
Three deliverables.
One simple goal.
| 1. Field Flight | 2. Crop health map | 3. Written report |
|---|---|---|
| We fly a planned grid over the block so coverage is even and one flight can be laid over the next. Nobody walks the crop, and you do not need to be there. | The frames are stitched and measured, then rendered on a single color scale so thin ground separates from healthy ground at a glance. | You receive the map with the areas worth checking marked, plus a short page explaining what was measured and what should be checked. |
WHAT ARRIVES
The sheet you
actually get back
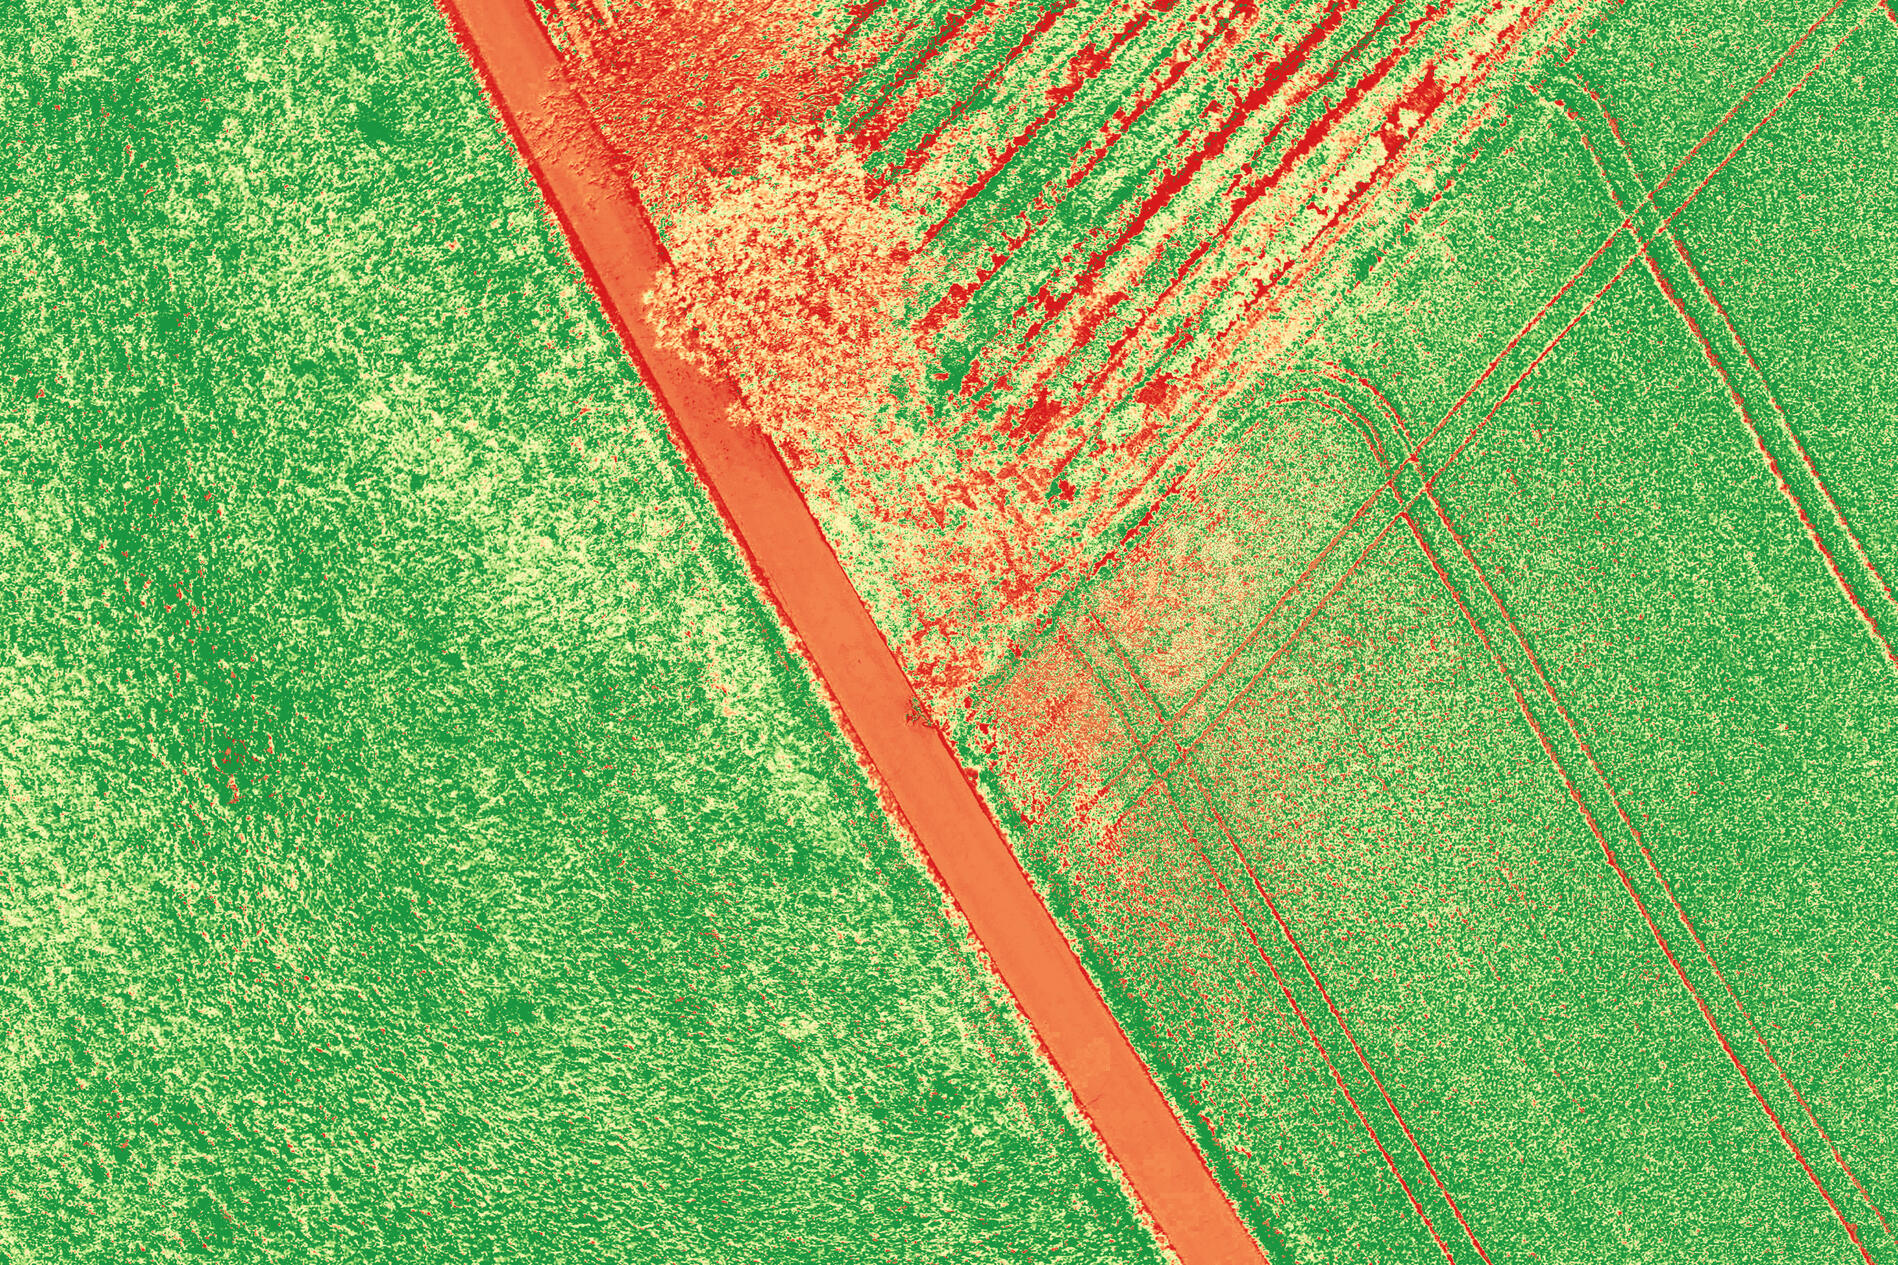
Because everything sits on one scale, a road, a footpath and a genuinely struggling patch do not have to be told apart by eye.
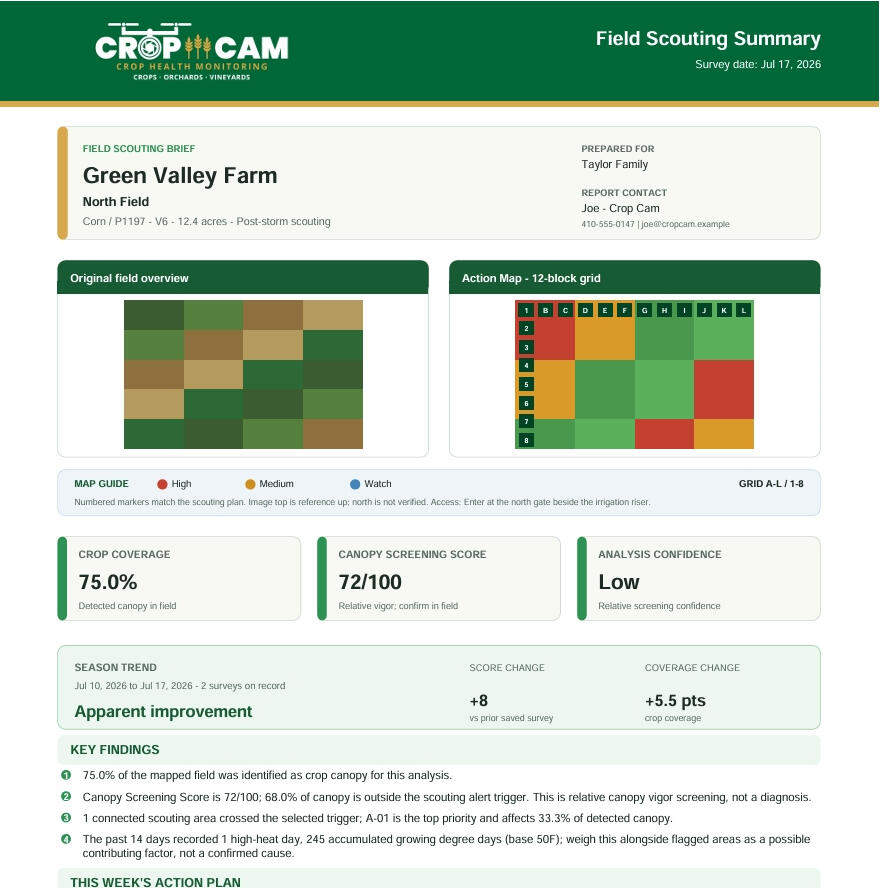
Every scan comes back as a marked map and a filled-in report sheet. This one is real, from a flight over a twelve-acre site in Maryland.
THE COLOR KEY
One scale, green
through red.
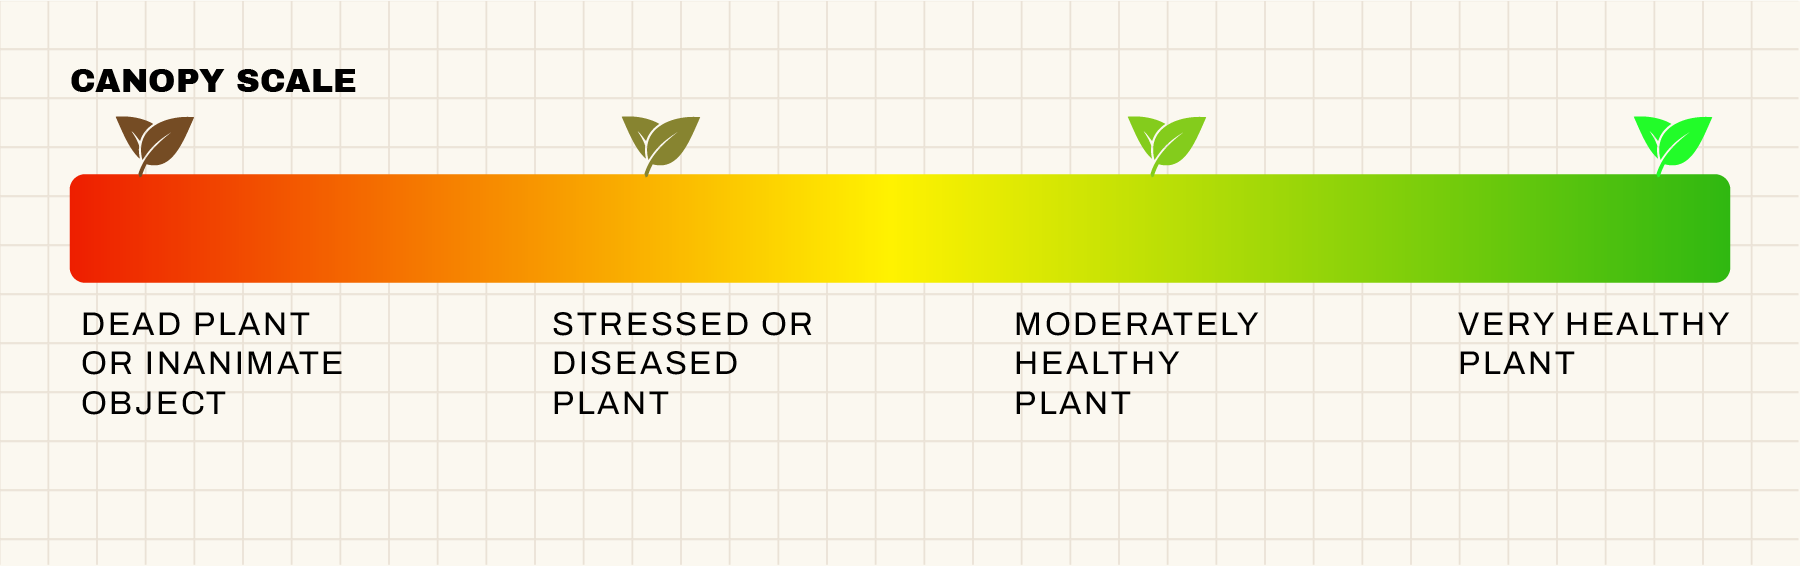
Every square of ground lands somewhere on the same strip,
from thick living canopy at one end to bare soil at the other.
Read the strip once and you can read any map we send.
The underlying measurement is a vegetation index — NDVI or VARI, depending on how the flight is set up. It is named in the report for your agronomist, and you never have to work with it directly.
Dark Green
Thick, even cover. This ground is doing what it was planted to do.
Light Green
Growing, but behind the ground beside it. This is usually the patch worth checking, because it is the one nobody notices from the row.
Yellow
Cover is patchy. A poor stand, standing water or compaction will all show up here.
Orange into red
Little or nothing living. Usually a lane, a turn row, a roof or open water — occasionally a real loss, and that is the one to go and look at.
STRAIGHT ANSWERS
What a scan is good
for, and what it is not.
It is good for
Finding ground that is behind the block around it before that is obvious on foot.
Measuring the same block the same way twice, so two flights are genuinely comparable.
Covering large acreage quickly, and narrowing it down to the parts worth your boots.
Putting the recent heat and rainfall beside the map so a rough patch has some context.
It is not
A diagnosis. It shows where something is off; you and your agronomist work out why.
A prescription. Nothing here tells you what to apply — confirm on the ground first.
A replacement for scouting or for knowing your own ground. It is a head start.
Software. There is nothing to install and no account to keep track of.
REQUEST A SCAN
Tell us about
the field.
Send a few details and you will get a straight answer on timing and cost for your acreage. No obligation, and no follow-up sequence.